In the fast-paced world of live streaming, data live graphics, and interactive content, creative ideas often hit a wall—not because of a lack of vision, but because of a lack of technical skills.
You imagine a sleek election result graphic with real-time updates, or a sports scoreboard that reacts instantly to match data. But then comes the hurdle: code. For many designers, presenters, or even producers, diving into scripting or data integration feels like a detour away from their core skill—visual storytelling.
That’s where zero-code graphic workflows come in.
These workflows empower creators to:
- Pull data from spreadsheets like structures
- Automate graphics in live shows
- Link design elements dynamically
… all without writing a single line of code.
Whether you’re using WASP3D, or any other modern design platforms, zero-code tools can drastically cut production time and eliminate technical dependency. Also, now with tools like WASP3D Xpress you can integrate your data into the graphics for free.
Where This Zero-Code Workflow Fits Perfectly
Zero-code data live graphics workflows are especially powerful when you’re streaming on popular livestream video platforms like Facebook Live and YouTube Live. These platforms demand fast updates, clean visuals, and engaging stream overlays that can react instantly to live data.
Creators using OBS Broadcaster software or vMix often struggle when it comes to updating dynamic elements like scores, election results, or lower thirds during a live show. By combining zero-code tools like WASP3D Xpress with these streaming setups, broadcasters can easily manage real-time data without relying on scripts or plugins.
Whether you’re building a sports scoreboard, election dashboard, or news ticker, these workflows seamlessly support live production across OBS, vMix, and other live environments.
Creating a Custom Database for Data Live Graphics Without Writing Code
Xpress, a free livestream graphics software, lets you build professional, data live graphic visuals—no coding required. You can create custom tables, add fields like text, numbers, colors, or images, and instantly link them to your on-air graphics.
Whether it’s for sports, elections, or talk shows, you can update data live with dropdowns and visual controls—no developer needed. Xpress empowers creators to manage dynamic content effortlessly. Update scores, votes, names, or stats in real time and see the changes instantly reflected on screen. Fast, visual, and completely free.
Why It Matters
Live broadcasts often need real-time updates: candidate leads, stock tickers, weather data, sports scores etc. Traditionally, this required a backend setup—complete with SQL tables, scripts, and developer hours.
Enter: User Defined Tables (UDTs)
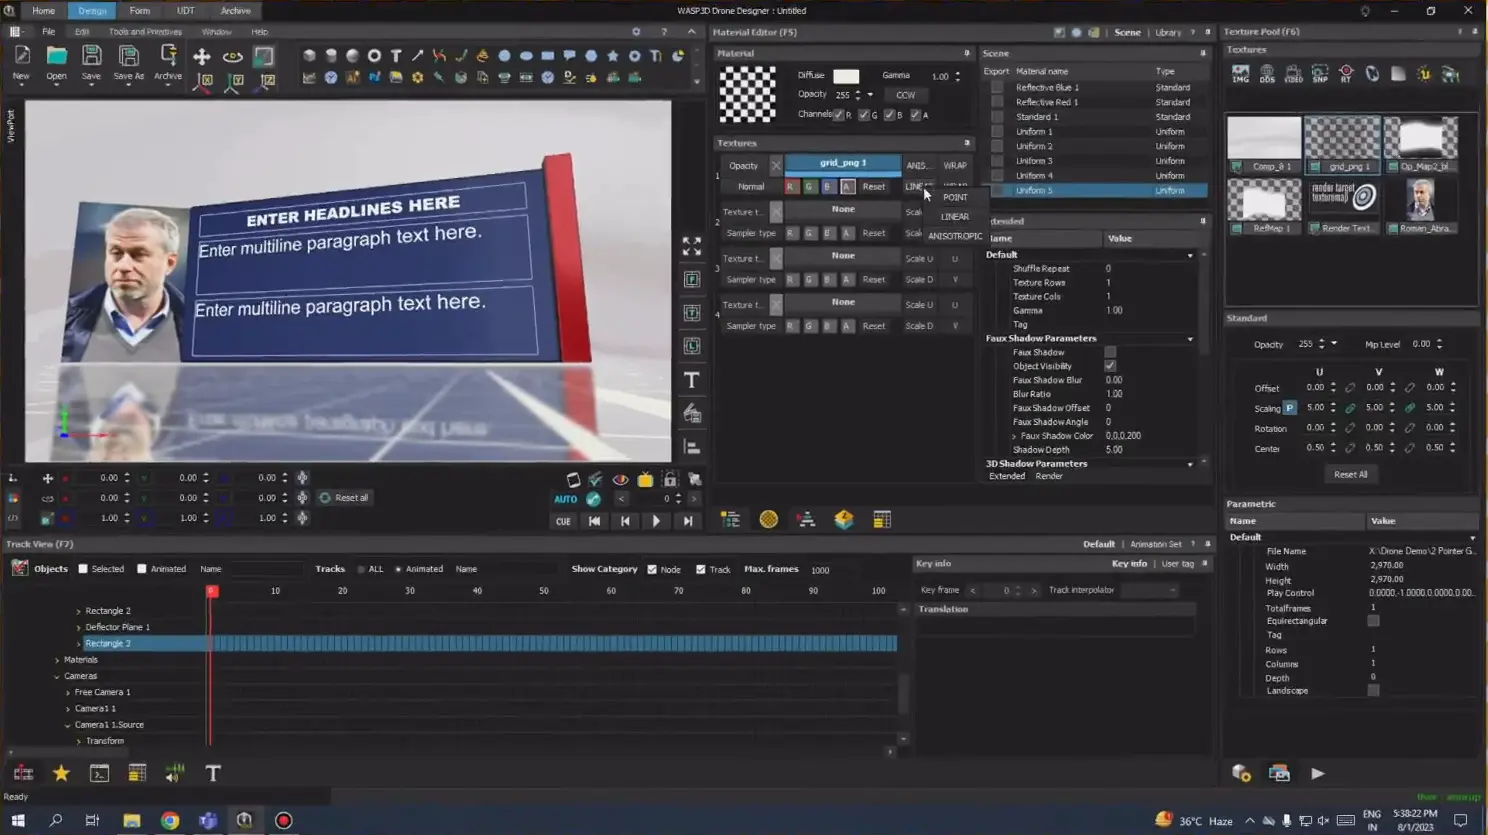
A User Defined Table is like a custom-built mini database you create directly inside your graphic engine (e.g., Wasp3D Designer or Rundown Manager).
Using Zero-Code Graphics with Pre-Designed Templates
Many creators rely on Premiere Pro templates or free After Effects templates to design graphics before going live. While these templates look great, they are mostly static and require manual edits every time data changes.
Zero-code platforms bridge this gap by allowing designers to:
-
Convert static lower third designs into data-driven graphics
-
Replace manual text edits with live data updates
-
Use the same visual logic across multiple scenes and shows
This means your lower thirds, charts, and stream overlays can update automatically during a live broadcast—something traditional editing templates can’t do on their own.
Why Use User-Defined Tables (UDTs) for Data Live Graphics?
User-Defined Tables (UDTs) make managing design data easy, fast, and flexible. Here’s why they’re a great feature to use:
- Organized Data in One Place
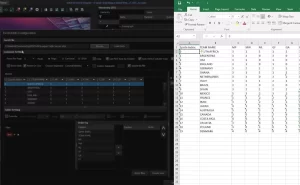
UDTs store data in a clean table format — rows and columns — just like a spreadsheet. - Easy to Create
Designers can create and customize tables directly within the application, no coding or external tools needed. - No Third-Party Tools Required
You don’t need Excel or SQL to manage your data. Everything is handled within the application, so there’s no extra software dependency. - Faster Access to Data
Since the data is built into the application, it loads quickly — speeding up your workflow. - Supports All File Types
UDTs can handle all kinds of data — even images and videos — making it perfect for rich, dynamic designs. - Works Across Modules
Once you create a table, it’s available in other modules too. Whether you’re in Drone Designer, Data Buzz, or Sting Client, you can easily update and reuse the same data.
No Coding Needed. How?
Utilizing Wasp3D Xpress makes it simpler for live streamers these days.
Example Use Case:
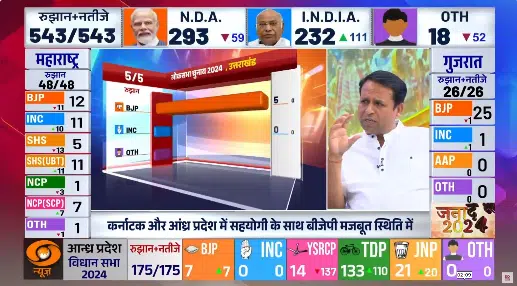
- In an election data live graphic, a table contains candidate names and vote counts.
- Add text to live Sports league tables.
- Change data in readymade pie charts
Linking Data to Live Graphics Objects for Smart Design
Why It Matters
Imagine designing a lower-third graphic with a player name and team color. Now imagine updating this in 10 different scenes every time something changes. Painful, right?
With object linking, you edit in one place, and it updates everywhere.
Modern tools offer:
- Parent-Child Linking: One object controls the behavior of others.
- Databinding: A text box pulls its value directly from a data source.
- Expression-Based Referencing: (e.g., link position of one object to another).
For example- You can create bar graphs for livestreams and update data directly on live using UDT.
This is incredibly useful for:
- Sports coverage (team names, scores, players)
- Elections (candidates, party logos)
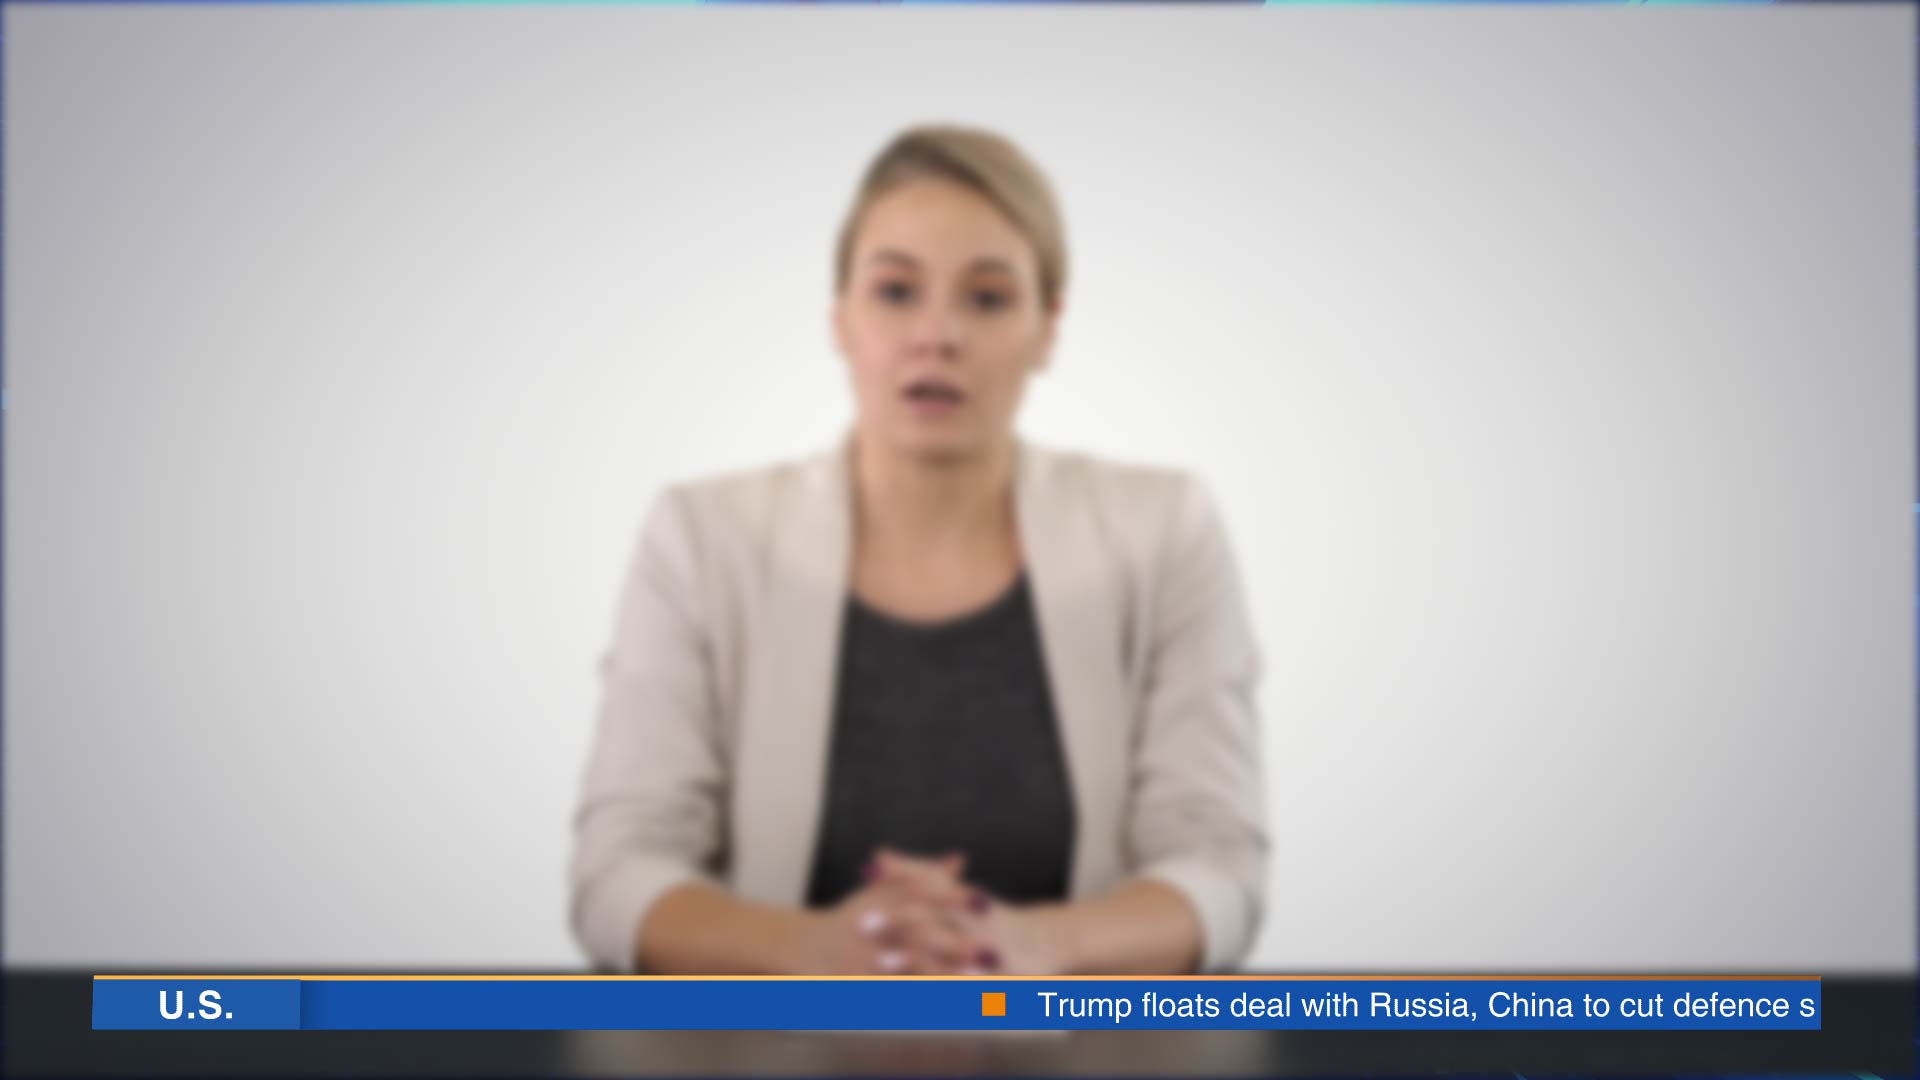
- News (breaking labels, timestamps)
Learn how to add data to scrolling text/tickers using UDT (Video Link)
Tools That Support This:
- WASP3D Xpress
- Adobe After Effects (using pick-whip or expressions)
- OBS with plugins like Source Dock and Text from File
Ideal for Modern Live Streaming Workflows
From solo creators streaming on YouTube Live, to newsrooms running election coverage on Facebook Live, zero-code graphic workflows are built for speed, scale, and simplicity.
They work perfectly alongside:
-
OBS Broadcaster software for YouTubers and streamers
-
vMix for professional live production
-
Multi-platform livestream video setups
The result? Faster production, fewer errors, and complete creative control—without writing code.
Conclusion
Zero-code isn’t just a trend—it’s a new creative standard.
Whether you’re a solo streamer, an educator, or running a broadcast studio creating data live graphic, you can now:
- Create databases
- Link visuals
- Control everything from a spreadsheet
- Automate your entire graphic flow
Bonus Tips for Getting Started
- Start Small: Automate a lower-third with data using Xpress.
- Explore Templates: Use pre-built templates by following sites like store.wasp3d.com that comes with prebuilt UDTs.
- Design for Scale: Use object linking and UDTs so your graphics can grow with your needs.
Ready to Design Without Limits?
With platforms like Wasp3D, you don’t need a degree in computer science to deliver high-end, real-time graphics. You just need a solid idea—and the right no-code tools to bring it to life.
If you’re a visual creator, broadcaster, teacher, or even a YouTuber, zero-code workflows are your gateway to professional-grade visuals with minimum effort and maximum impact.
Design faster. Think bigger. And leave the code behind.
FAQs
1. Can I use zero-code data live graphics with YouTube Live and Facebook Live?
Yes. Zero-code graphic tools work seamlessly with YouTube Live and Facebook Live when paired with streaming software like OBS Broadcaster software or vMix, allowing real-time updates without coding.
2. How do zero-code tools improve stream overlays?
Zero-code tools make stream overlays dynamic. Instead of manually updating text or visuals, you can link overlays to live data tables and update scores, names, or stats instantly during the stream.
3. Can I use lower third graphics without After Effects coding?
Absolutely. You can create professional lower third graphics using zero-code platforms and control them live—no need for expressions, scripting, or advanced After Effects skills.
4. Are Premiere Pro templates and free After Effects templates suitable for live data?
While Premiere Pro templates and free After Effects templates are great for pre-produced videos, they are mostly static. Zero-code live graphic tools are better for real-time data updates during live streams.
5. Do zero-code graphics work with OBS and vMix?
Yes. Zero-code data live graphics integrate smoothly with OBS Broadcaster software and vMix, making them ideal for sports, elections, news, and interactive livestream video platforms.