What Are Sports Broadcast Data Graphics?
Modern sports broadcast data graphics have become essential for delivering real-time statistics and engaging viewer experiences.. In modern sports broadcasting, broadcast graphics software is no longer an overlay on top of video. They are part of the live system itself driven by data, shaped by workflows, and controlled under pressure.
The term sports broadcast graphics software is often misunderstood as a design tool. But broadcast graphics software it refers to a tightly integrated system that connects live data, processing logic, rendering engines, and operator control into a single real-time pipeline.
To understand how this works in practice, you must move away from thinking in terms of “graphics” and start thinking in terms of flow.
Also learn how to create data-linked animated graphics for OBS & vMix

Sports Broadcast Data Graphics: From Static Overlays to Real-Time Systems
There was a time when sports graphics were manually updated. A score bug was typed in. A lower third was triggered with pre-filled text. Updates were deliberate and slow. The accuracy of sports broadcast data graphics depends on reliable live data sources.
That model breaks completely in today’s environment. This is where modern broadcast graphics software begins to play a critical role.
Modern sports production is:
- multi-platform (broadcast, OTT, social, in-stadium)
- data-heavy (live stats, player tracking, historical comparisons)
- time-sensitive (updates expected instantly)
A one-second delay in updating a score is no longer acceptable. A mismatch between live action and on-screen data immediately breaks viewer trust.
This is why graphics systems have evolved into real-time, data-connected engines rather than standalone tools.
Data Is the Starting Point—But It’s Not Ready to Use
Every sports broadcast begins with data, but that data does not arrive in a clean, usable format. This is one of the key challenges that broadcast graphics software is designed to solve.
In a typical production environment, data flows in from multiple sources simultaneously. Official league APIs provide structured match updates. Manual scouting systems fill in gaps where automation doesn’t exist. In higher-tier productions, tracking systems and sensors add positional and performance data.
In practical workflows, this is where flexible systems gain importance. For example, many productions especially mid-scale or esports use structured sources like Google Sheets alongside APIs. Platforms such as Wasp3D allow these mixed inputs to coexist, mapping them directly into graphics without forcing rigid data pipelines.
From Data to Meaning: The Role of Real-Time Processing
Raw data does not create good broadcasts. Interpretation does. This is where advanced broadcast graphics software adds real value.
It interprets the event and triggers a sequence of actions. The scoreboard changes. Player information becomes relevant. In some cases, contextual stats or sponsor elements are prepared automatically.
This requires a processing layer that works in real time, applying logic to incoming data.
That logic can include:
- event recognition (goal, wicket, kill, lap completion)
- conditional triggers (milestones, comparisons, rankings)
- prioritization (which update should be shown first)
What emerges is not a data display system, but an event-driven engine.
In modern sports production, the ability to connect directly with live data sources defines how responsive your graphics can be. Systems like Wasp3D allow integration with multiple real-time feeds whether it’s XML, JSON, RSS, or even direct eSports game APIs. Scores update instantly, player stats refresh in real time, and any change in the data reflects immediately in the graphics without manual intervention.
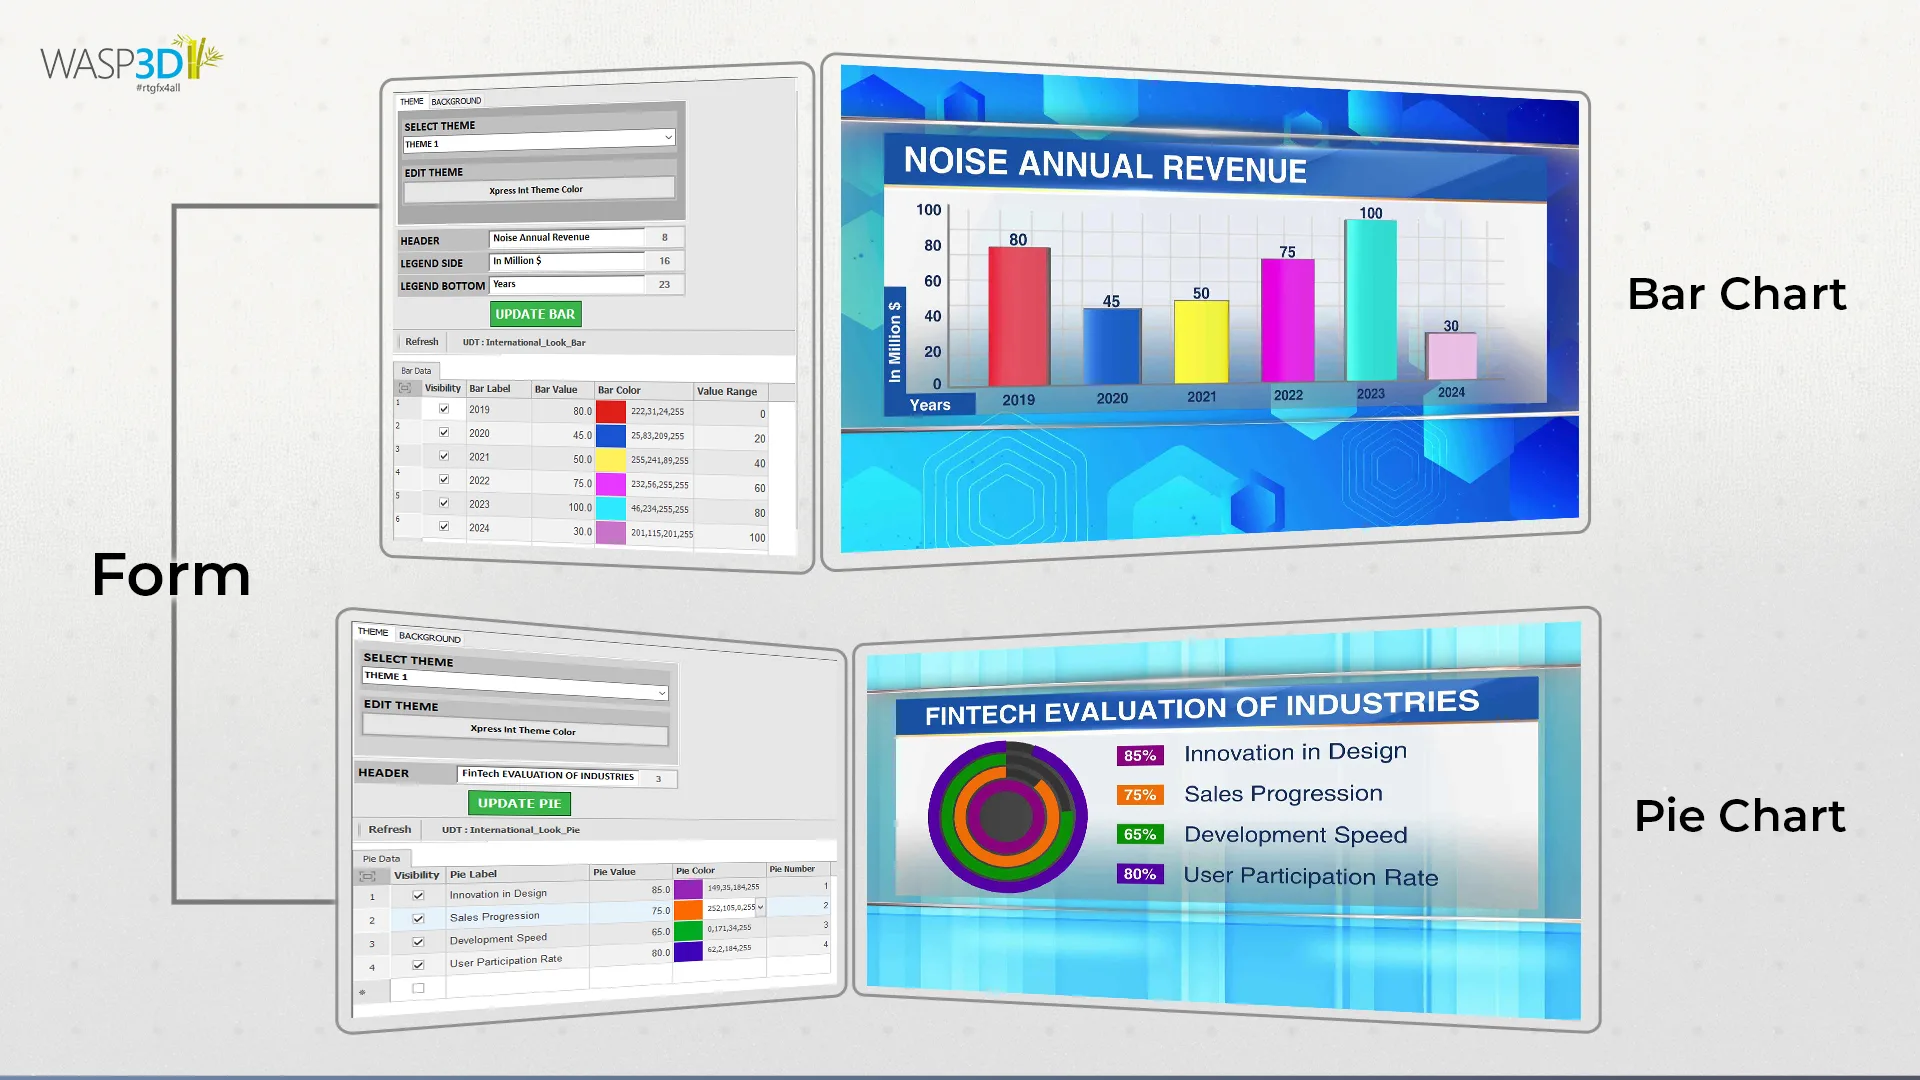
This same data can also be visualized in formats that are easy for viewers to understand during a live match. Bar charts for player comparisons, pie charts for distribution insights, and line graphs for momentum tracking can all be generated dynamically. The key is that these visuals are not pre-designed static elements they are built to respond to live inputs, making every graphic context-aware and current.
Another important layer in this workflow is control. Instead of locking everything into a fixed interface, the system allows third-party developers to build custom control panels tailored to specific production needs. These interfaces can handle everything from loading graphics and triggering animations to managing data changes across multiple outputs.
This flexibility ensures seamless integration with external applications and gives production teams the freedom to design workflows that match how their live environment operates, rather than adjusting their process to fit the tool.
How Sports Broadcast Data Graphics Use Dynamic Templates
One of the most misunderstood aspects of sports broadcast graphics software is the role of design.
In live production, graphics are not created during the match. They are prepared in advance as templates but these are not static layouts. They are dynamic structures connected to data fields and logic.
A scoreboard template, for example, defines:
- where the team names appear
- how scores update
- what animation plays when values change
- how the timer behaves under different conditions
This approach allows for consistency across matches and tournaments. More importantly, it enables speed. Operators are not building graphics they are working with systems that are already configured to respond.
In practical terms, platforms like Wasp3D emphasize reusable, data-linked templates that can be deployed across multiple matches without rebuilding logic each time. This becomes critical in tournaments where scale and repetition are constant. At this stage, broadcast graphics software shifts from processing to structured visual output.
Designing Sports Graphics with Wasp3D Designer
While data drives the output, the visual layer still defines how the audience experiences it. This is where broadcast graphics software connects design with real-time execution. Wasp3D Designer acts as the interface where all sports graphics are created, structured, and prepared for live use.
It provides a complete 2D/3D design environment with cameras, materials, lighting, textures, and a timeline to animate the entire scene. Along with a modern, customizable interface, it also supports template creation and even virtual set design making it suitable for both simple overlays and more advanced broadcast visuals.
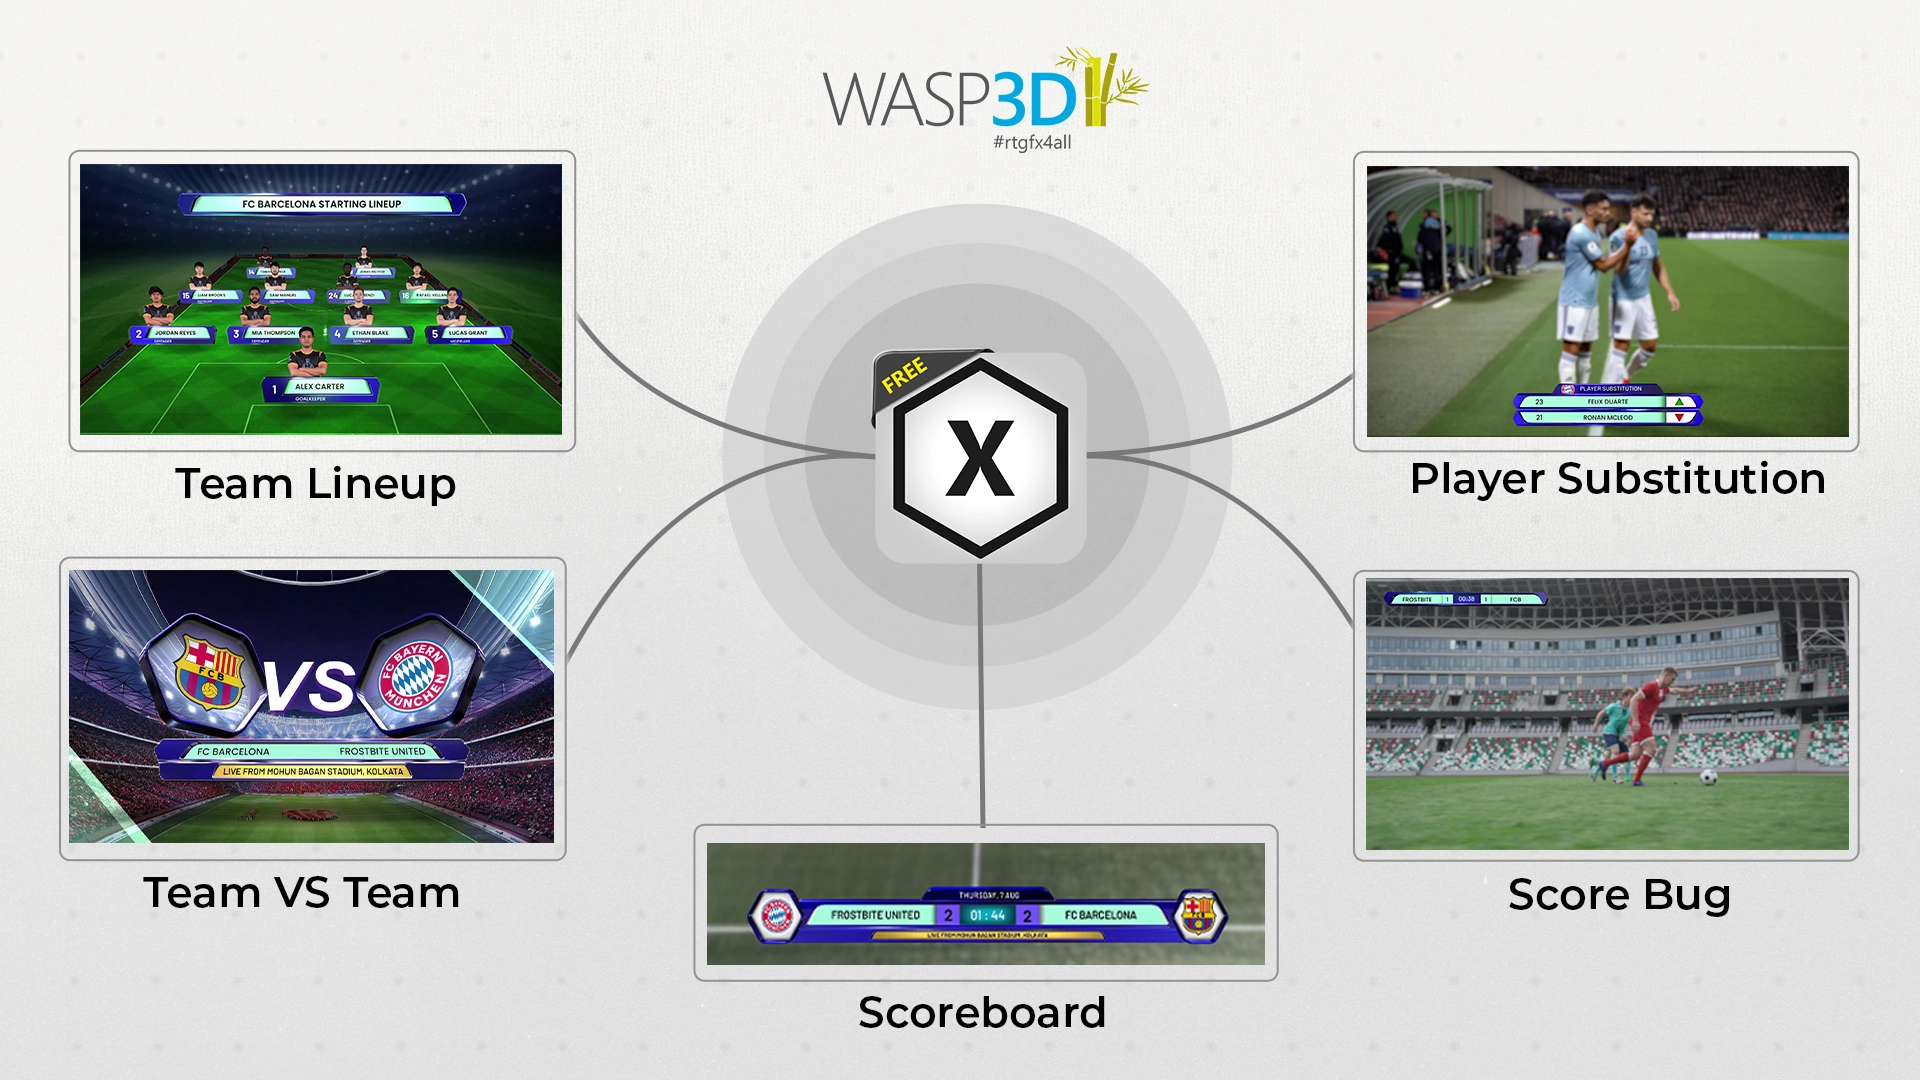
Instead of building static visuals, designers create data-ready templates that can adapt during a live match. This includes:
- Player Profiles for introductions and highlights
- Social Media Graphics for live engagement
- Scoreboard Graphics tailored to each sport
- Match Schedules for pre and post-match segments
- Player Comparison Graphics using charts and stats
- Titles and Lower Thirds for on-air information
- Bugs and Persistent Elements for branding and sponsors
Unlike traditional design workflows, there is no rendering phase. The output must be immediate. This is a defining capability of any professional broadcast graphics software.
The system generates visuals frame by frame, synchronized with the live video feed.
This requires:
- low-latency rendering pipelines
- efficient handling of dynamic text and data
- stable performance under continuous updates
In high-pressure environments, the expectation is simple:
if the data changes, the graphic must reflect it instantly without flicker, delay, or error.
This is where the distinction between general-purpose design tools and true sports broadcast graphics software becomes clear.
Adapting Sports Broadcast Data Graphics Across Different Sports
A good broadcast graphics software system adapts these requirements dynamically across sports. Not all sports behave the same on screen and neither should their graphics. The type of data, speed of gameplay, and viewer expectations decide what kind of visuals actually work during a live broadcast. A good workflow isn’t about designing once it’s about adapting graphics and data logic for each sport.
Basketball Scoreboard
Basketball is fast and continuous, so a Basketball Scoreboard needs:
- Instant score updates
- Shot clock integration
- Player fouls and timeouts
Graphics that work best:
- Compact scoreboards with shot clock
- Player stat pop-ups (points, assists, rebounds)
- Quick comparison bars during breaks
Focus: speed + minimal obstruction
Football Scoreboard (Soccer)
A Football Scoreboard is simple but context-driven:
- Score and match timer
- Possession and passing stats
- Substitutions and cards

Graphics that work best:
- Clean top/bottom scorebars
- Lower thirds for player changes
- Occasional full-screen stats (possession, shots on target)
Focus: minimal visuals, high-impact moments
Baseball Scoreboard
- Innings progression
- Pitch count
- Player and team stats
Graphics that work best:
- Detailed scoreboards with innings layout
- Pitch tracking visuals
- Situational graphics (bases loaded, strike zones)
Focus: structure + context over time
Tennis Scoreboard
- Points → Games → Sets
- Serve indicators
- Break points
Graphics that work best:
- Clean hierarchical scoreboards
- Serve and rally indicators
- Match summary panels during breaks
Focus: accuracy + clarity
Volleyball Scoreboard
A Volleyball Scoreboard revolves around sets and rallies:
- Set scores
- Live point updates
- Rotations and substitutions
Graphics that work best:
- Set-based scoreboards
- Rotation visuals
- Quick player stat highlights
Focus: structured but fast updates
Hockey & Lacrosse Scoreboards
Both Hockey Scoreboard and Lacrosse Scoreboard setups are fast and physical:
- Period-based scoring
- Penalties and power plays
- Rapid transitions
Graphics that work best:
- Scoreboards with penalty timers
- Power play indicators
- Replay overlays for key moments
Focus: clarity during high-speed action
One System, Multiple Sports Workflows- WASP3D
This flexibility is only possible with scalable broadcast graphics software. Each sport demands a different approach speed in basketball, structure in baseball, logic in tennis, and complexity in esports. But underneath, the workflow remains the same:
- Data comes in
- It connects to templates
- Graphics update in real time
Systems like Wasp3D are built to handle this variation without requiring separate setups for each sport. Whether it’s a simple scoreboard or complex overlay, the same system can adapt through:
- Flexible templates
- Real-time data mapping
- Multi-sport compatibility
If you’re exploring how to set this up for your own production, it’s worth seeing how it works in a real environment walking through an actual workflow often makes things clearer than documentation ever can.
Control: Why Human Operators Still Matter
Despite advances in automation, live sports production is not fully automated and it shouldn’t be. Even the most advanced broadcast graphics software depends on human control.
Operators play a critical role in:
- selecting the right moment for a graphic
- prioritizing information based on match context
- avoiding overload during high-action sequences
For instance, a player reaching a milestone is important. But showing that graphic during a critical live moment may disrupt the viewer experience.
This is why effective systems are designed with a hybrid model:
- automation handles repetitive updates (scores, timers, base stats)
- operators control editorial elements
In real-world workflows, this balance defines production quality. Systems that over-automate reduce flexibility. Systems that rely entirely on manual control slow down execution.
Supporting Layers: Charts, AR, and Replays
As production capabilities expand, additional layers like charts, augmented reality (AR), and replays become part of the graphics ecosystem.
However, their effectiveness depends on restraint.
Charts are useful only when they simplify comparison. A bar chart showing player performance works because it is instantly readable. Complex visualizations, on the other hand, often fail in live contexts where attention spans are short.
AR introduces a different dimension. It allows broadcasters to visualize elements that are not visible in the live feed—player positioning, trajectories, tactical setups. When used correctly, it enhances understanding. When overused, it becomes distraction.
Replays remain one of the most powerful tools in sports production. They do more than repeat action—they provide context, clarity, and emotional reinforcement.
Scaling Sports Broadcast Data Graphics for Large Events
The underlying workflow of sports broadcast graphics software remains consistent across production scales. This is a core strength of modern broadcast graphics software platforms. What changes is complexity.
In smaller setups, a single operator may manage data through tools like Google Sheets, feeding directly into the graphics system. The focus is on efficiency.
In larger tournaments, the structure expands:
- multiple data sources feed into the system simultaneously
- dedicated roles manage data, graphics, and replay operations
- templates are standardized across matches for consistency
What becomes critical at scale is not just capability, but stability and coordination.
Systems that allow flexible data integration and reusable templates—such as Wasp3D tend to adapt more easily across different production sizes because they do not rely on a single rigid workflow.
Why Workflow Matters More Than Features in Sports Broadcast Data Graphics
A common mistake in evaluating sports broadcast graphics software is focusing on features instead of understanding how well the broadcast graphics software fits into live workflows number of animations, design capabilities, or visual effects.
In live production, these matter less than:
- how cleanly data flows into the system
- how reliably graphics update
- how easily operators can control output
A system with fewer features but better workflow alignment will outperform a feature-rich system under live conditions.
Because ultimately, the viewer does not see the software.
They see the result of how well that software handles flow under pressure.
Final Thought: Sports Broadcast Data Graphic Software It’s a System, Not a Tool
In reality, modern sports broadcast graphics software is the backbone of live production systems, it is the point where data, logic, rendering, and human decision-making converge in real time.
When this system works:
- graphics feel natural, not forced
- updates feel instant, not reactive
- the broadcast feels seamless
And when it doesn’t:
- even the best design cannot compensate
The future of sports production will continue to push toward more data, more speed, and more complexity.
But the core principle will remain unchanged:
Clean data, structured logic, real-time execution, and controlled delivery. Effective sports broadcast data graphics help broadcasters deliver accurate and engaging live productions.
FAQS
What is sports broadcast graphics software?
Sports broadcast graphics software is used to create scoreboards, player statistics, lower thirds, and other real-time visuals for live sports productions.
Can you recommend tools for designing sports broadcast graphics?
Popular options include WASP3D, OBS Studio, and other broadcast graphics platforms. The right choice depends on your production scale and workflow requirements.
What are the best software options for creating live sports broadcast graphics?
The best software offers real-time data integration, customizable templates, automation, and professional output support. WASP3D is one solution designed for sports broadcasting workflows.
Is WASP3D suitable for sports broadcast graphics?
Yes. WASP3D supports scoreboards, player stats, live data feeds, animations, and multi-sport graphics, making it suitable for sports productions of different sizes.
What features should sports broadcast graphics software include?
Look for real-time data connectivity, dynamic templates, automation, customizable graphics, and support for live production environments.
Can sports broadcast graphics software integrate with live data feeds?
Yes. Modern solutions like WASP3D can connect with APIs, XML, JSON, databases, and other data sources to update graphics automatically during live events.
Which software is best for creating sports scoreboards?
Software that supports real-time updates and customizable templates is ideal. WASP3D provides scoreboard templates for sports such as football, cricket, basketball, tennis, and more.