Regional news broadcasting has changed dramatically in the last few years. Earlier, election coverage was mostly dominated by national television networks. Today, regional news channels are becoming the primary source of political updates for millions of viewers. Audiences now want hyperlocal election coverage that focuses on their constituency, local candidates, regional parties, and state-level trends.
This shift has increased the demand for specialized election graphics software that can handle fast-moving election data while delivering visually engaging coverage in multiple regional languages. From assembly elections and municipal polls to panchayat elections, regional broadcasters need systems that can process large amounts of real-time data without slowing down live production.
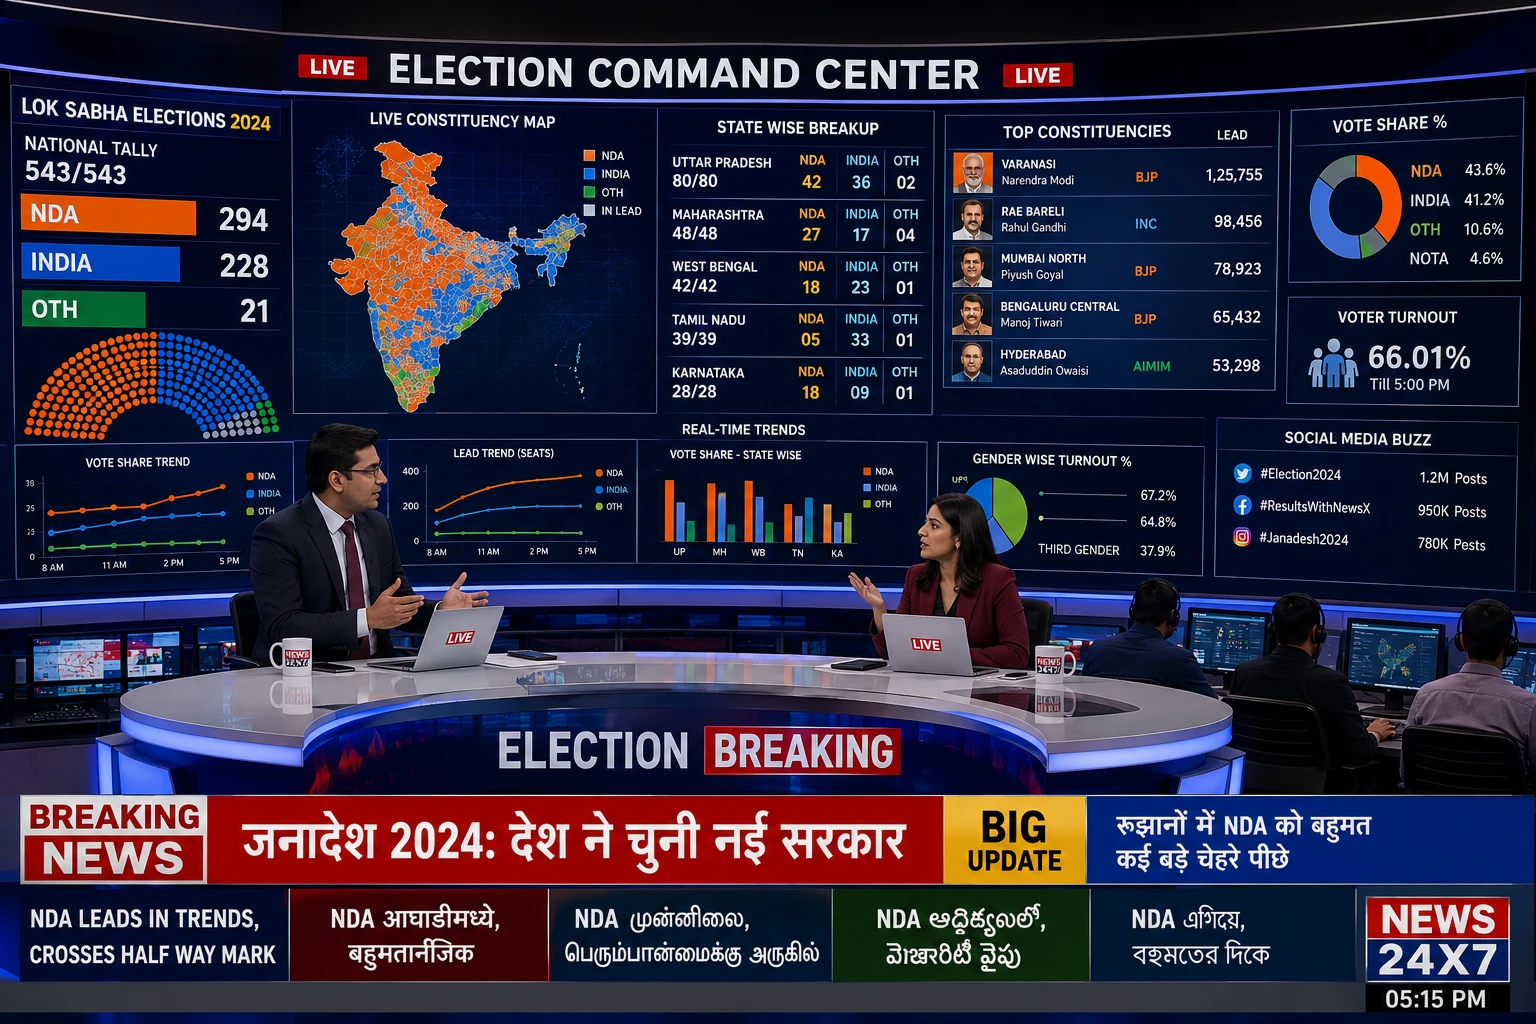
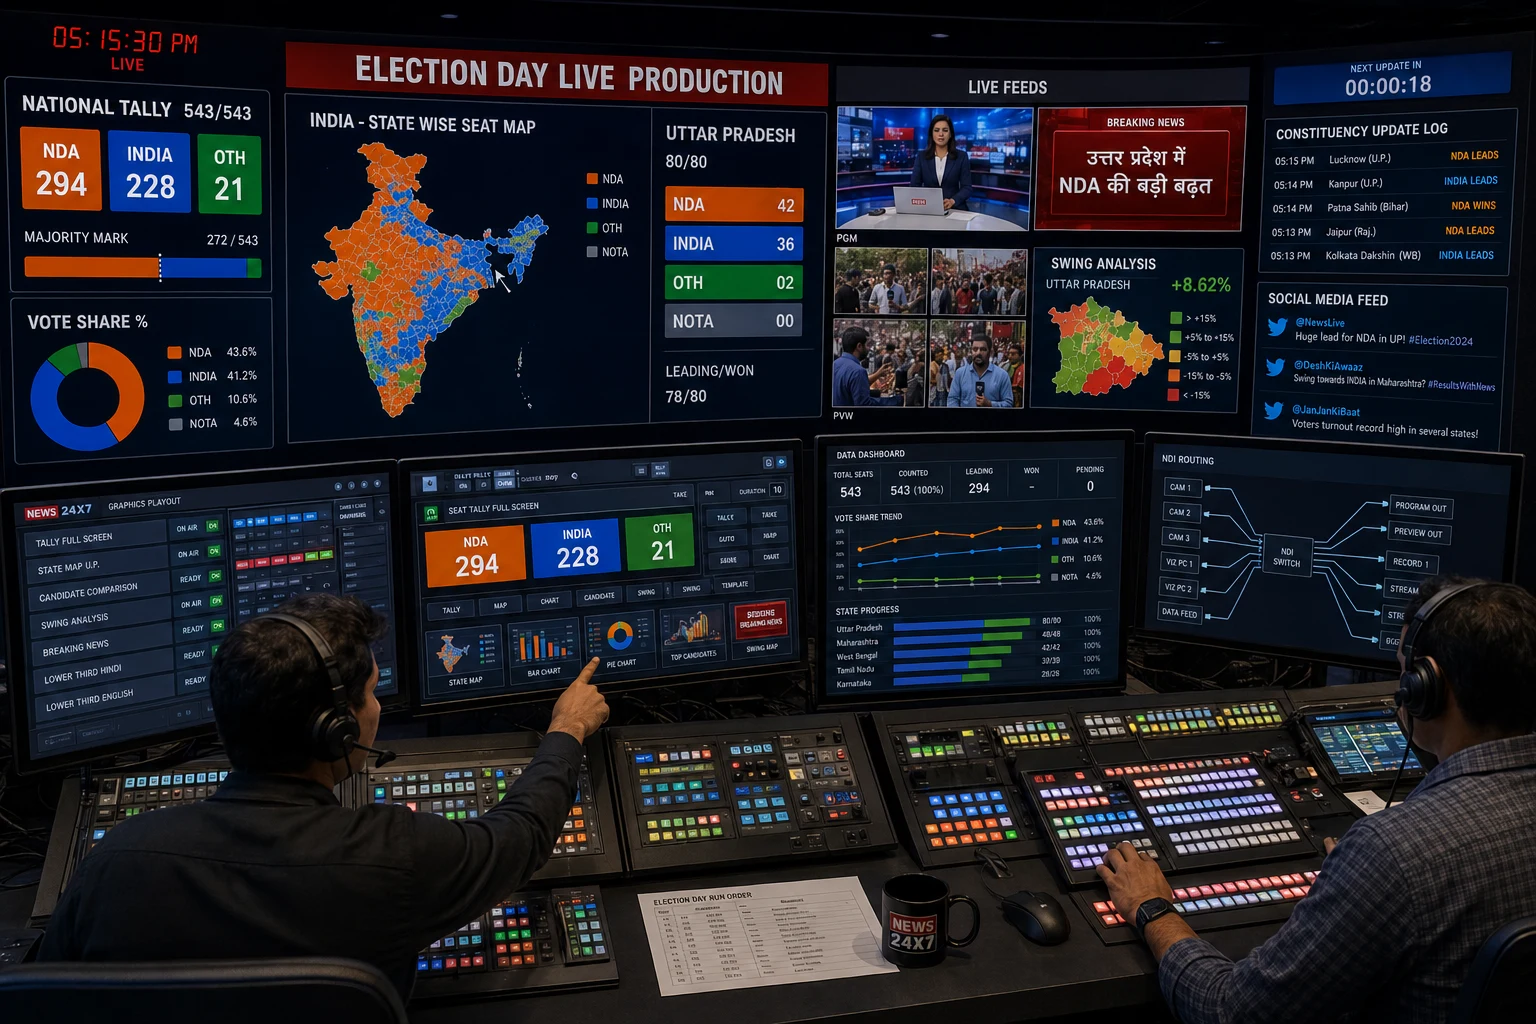
At the same time, viewers expect modern visuals similar to national broadcasts. They want live vote counts, animated seat tallies, constituency maps, trend tickers, candidate comparisons, and real-time analysis during counting day. Managing all of this manually is almost impossible for most regional channels. This is where advanced election graphics solutions play an important role.
What is Election Graphics Software?
Election graphics software is a specialized real-time broadcast graphics system designed specifically for election coverage. It helps news channels visualize election data in a clear, dynamic, and engaging format during live broadcasts and streaming.
Unlike generic graphics tools, election focused systems are built to handle live election logic such as:
- Vote percentage calculations
- Seat tallies
- Leading vs winning status
- Constituency wise comparisons
- Party performance tracking
These systems automatically convert raw election data into professional on screen live graphics. Modern election graphics platforms can ingest data from APIs, spreadsheets, or manual entry systems and instantly update live graphics across television broadcasts, YouTube streams, mobile apps, and social platforms.
They also support multiple graphic formats, including lower thirds, full-screen dashboards, touch-screen visuals, trend tickers, bar graphs, pie charts, and interactive election boards. For regional broadcasters, this technology has become essential because election coverage now depends heavily on speed, clarity, and visual storytelling.
Why Regional News Channels Face Unique Election Challenges
Regional election coverage is very different from national broadcasting. State elections often involve hundreds of constituencies, multiple regional parties, and constant vote swings throughout the counting process.
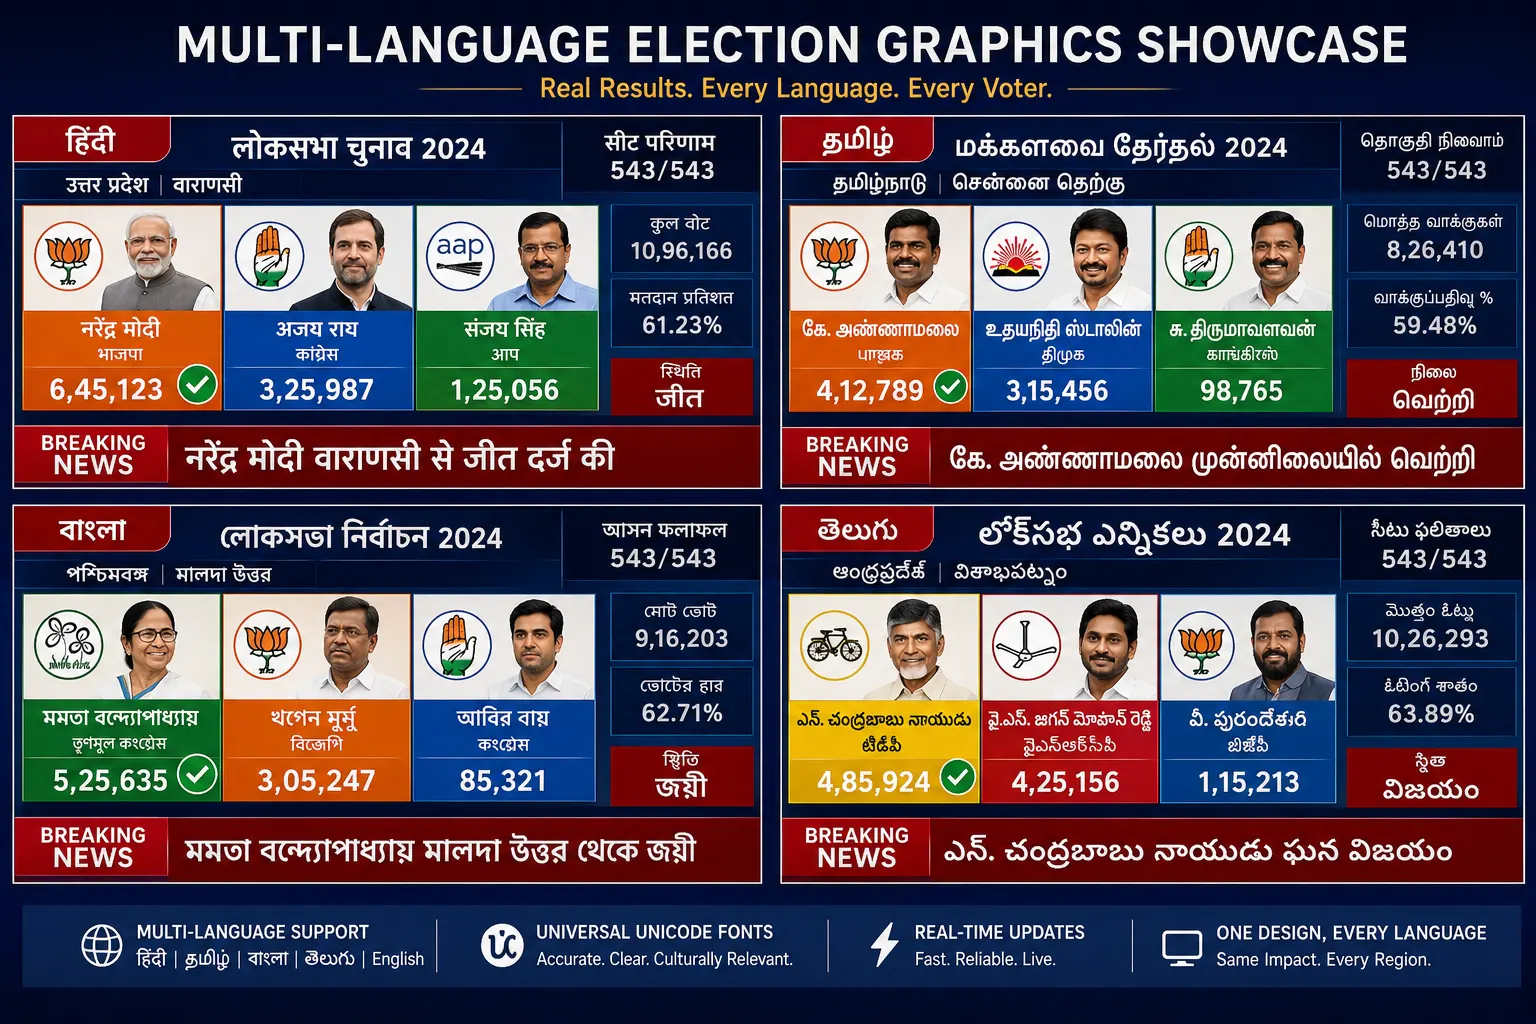
Multi-Language Graphics Rendering
One of the biggest challenges for regional channels is language support. News channels may need graphics in Hindi, Tamil, Bengali, Marathi, Telugu, Kannada, or multiple languages simultaneously.
Rendering regional fonts correctly in live graphics is not always easy. Dynamic text sizing, font compatibility, and layout balancing become difficult when candidate names or constituency names change length frequently during live updates.
A reliable election graphics software must support unicode rendering and automatic text adjustments to ensure graphics remain readable and visually clean.
Constituency-Level Data Complexity
Regional elections generate massive amounts of constituency-level data. A single state election may involve hundreds of seats and thousands of candidate records updating every few seconds.
Broadcasters need systems that can quickly display candidate names, party symbols, vote counts, lead margins, swing percentages, constituency trends. At the same time, the software must aggregate all this information into state-wide party tallies and majority projections. Handling this manually increases the risk of errors during live broadcasts.
Limited Technical Infrastructure
Unlike national broadcasters, many regional channels work with smaller production teams and tighter budgets. They often need automated workflows that reduce manual operations.
Modern election graphics systems simplify production by automatically updating on-screen graphics through real-time data feeds, APIs, and newsroom integrations. This allows smaller teams to manage large-scale election coverage more efficiently.
Real-Time Accuracy Pressure
Election broadcasts are highly competitive. Every channel wants to report updates first, but speed without accuracy can damage credibility. Broadcasters need graphics systems that support data validation, manual overrides, and real-time corrections. Reliable automation reduces the chances of incorrect vote counts appearing on screen.
Multi-Platform Distribution
Today’s election coverage is no longer limited to television. Regional broadcasters now stream election content across YouTube, Facebook, OTT apps, and mobile platforms. This creates additional production challenges because graphics must adapt to multiple screen sizes and aspect ratios. A single workflow that supports broadcast and digital outputs has become extremely important.
Key Features to Look for in Election Graphics Software
Choosing the right system is critical for successful election coverage.
Real-Time Data Integration
The software should support both automated APIs and manual data entry. Election data often comes from multiple sources, including Election Commission feeds, newsroom systems, and third-party aggregators. Real-time synchronization ensures graphics update instantly during live counting.
Template-Based Automation
Pre-designed election templates save valuable production time. Broadcasters should be able to trigger graphics automatically based on live data changes. For example, if a candidate crosses the winning threshold, the system should automatically update the graphic status from “Leading” to “Won.”
Multi-Language Support
Regional channels require flexible language rendering capabilities. Good systems support dynamic font switching and unicode compatibility for regional scripts. This is especially important for bilingual or multilingual broadcasts.
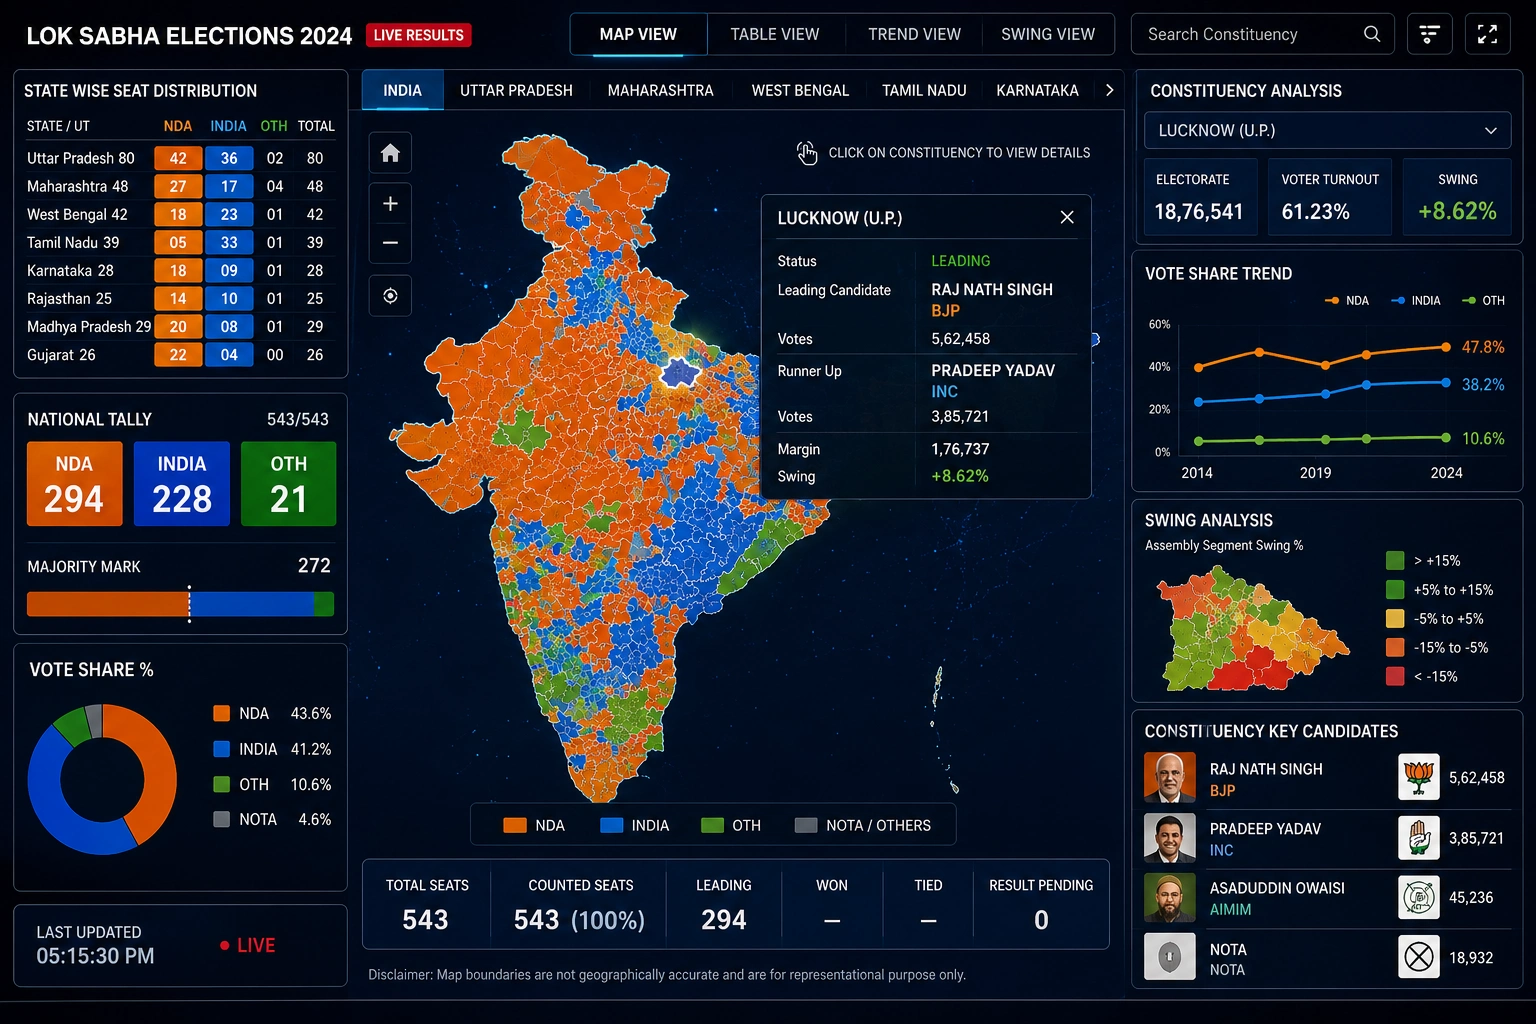
Advanced Data Visualization
Modern election coverage depends heavily on visual storytelling. Features like seat distribution maps, animated charts, party comparison boards, trend graphics, bar graphs, and pie charts help audiences understand complex election data quickly. These visual elements improve viewer engagement significantly.
Scalability Under Heavy Load
Election days involve extremely high data volumes. Software should be capable of handling hundreds of constituencies and simultaneous graphic updates without lagging. Performance stability becomes critical during peak counting hours.
Types of Election Graphics Used in Regional Broadcasts
Regional election broadcasts use multiple graphic formats to explain live results clearly.
Lower thirds are commonly used to display candidate names, party affiliations, and vote counts during discussions and interviews.
Full-screen dashboards show seat tallies, majority marks, and state-wide party standings.
Constituency result boards help viewers track detailed local results in real time.
Trend tickers continuously display quick updates from multiple constituencies simultaneously.
Interactive touch-screen graphics allow anchors to explain election swings, regional voting patterns, and party performance visually.
Charts such as bar graphs and pie charts are also widely used for comparing vote shares and seat distributions.
Together, these elements create a more immersive viewing experience.
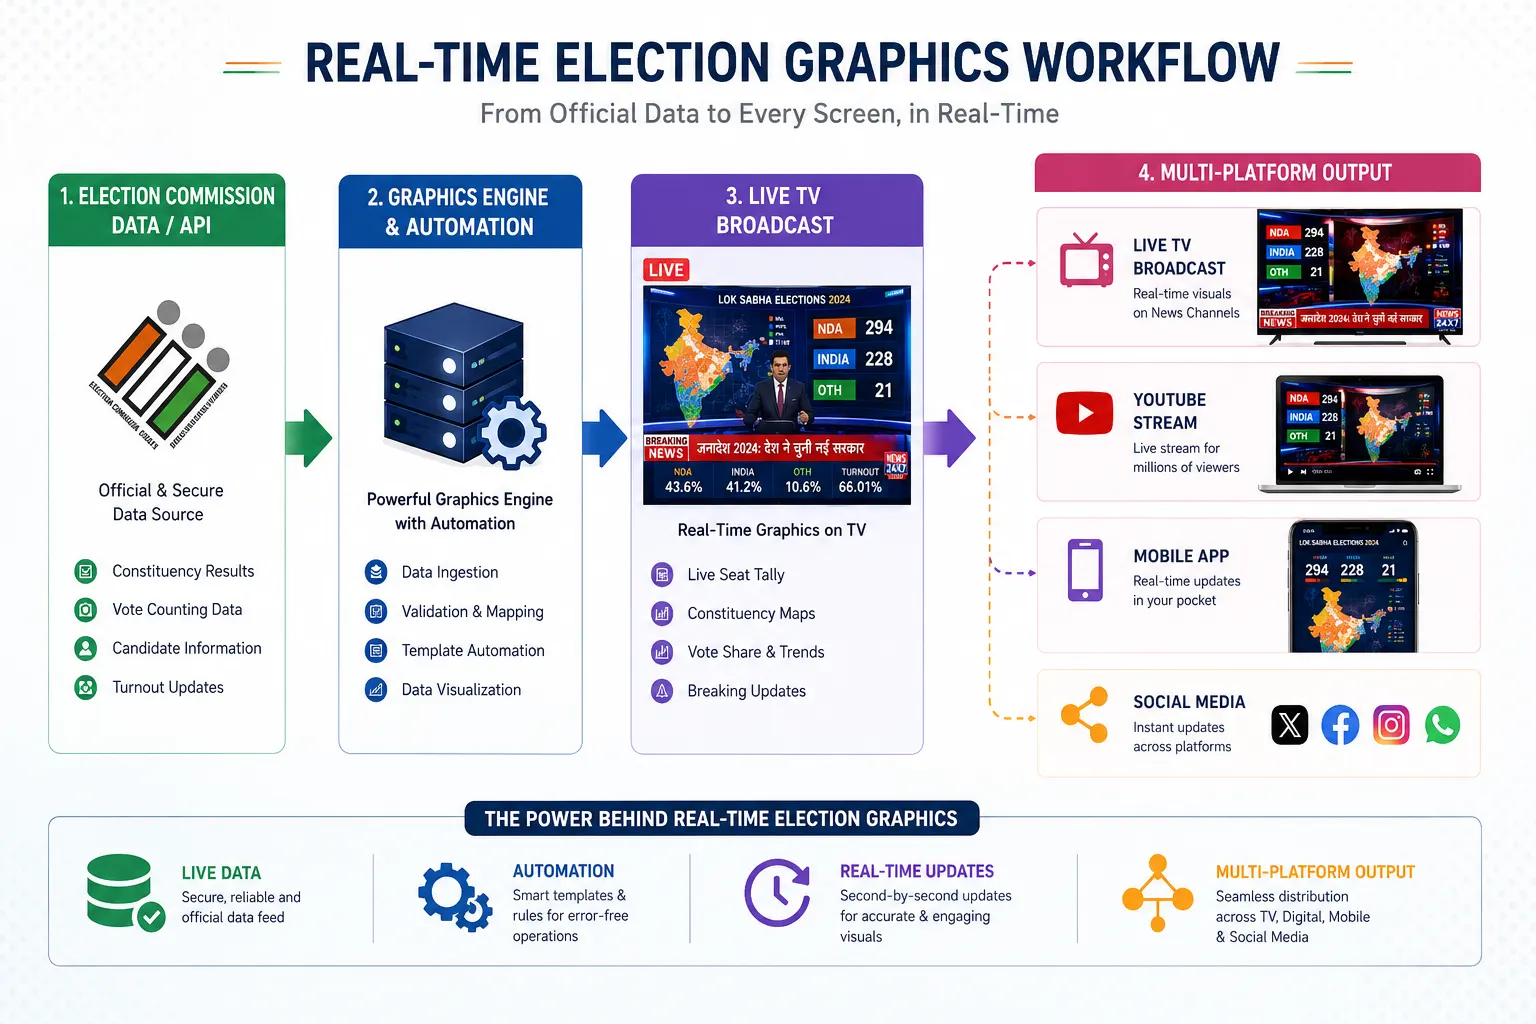
How Election Graphics Software Works During Live Coverage
The election production workflow usually begins with data ingestion. Information enters the system through APIs, spreadsheets, or manual entry operators.
The software then validates and maps the incoming data to predefined templates. Once verified, the graphics engine automatically updates live visuals in real time.
The rendered graphics are then sent to:
- Broadcast systems through SDI or NDI
- Streaming platforms like YouTube and OTT apps
- Social media clips and mobile outputs
This workflow reduces manual intervention and ensures faster updates during live election broadcasts.
How Modern Solutions Help Regional Broadcasters
Automation has become one of the biggest advantages of modern election graphics systems. Instead of manually editing every graphic, broadcasters can automate updates using live data triggers. This reduces errors and improves production speed significantly. Pre-built election templates also help channels prepare faster during breaking political coverage.
Solutions such as WASP3D PRO and WASP3D Fluid are designed to simplify complex election broadcast workflows. These systems support real-time data integration, automated graphic updates, regional language rendering, and large-scale election result visualization during live broadcasts. Their automation-driven architecture helps regional broadcasters manage constituency-level election coverage efficiently across television, streaming, and digital platforms.
For regional channels with limited production teams, automation-driven workflows can dramatically improve efficiency without requiring large infrastructure investments.
Real-World Election Broadcast Scenarios
During state assembly elections, broadcasters may need to monitor more than 200 constituencies simultaneously. Real-time seat tally graphics become essential for keeping viewers updated throughout the counting process.
Regional language channels often use dual-language graphics to cater to broader audiences. For example, Hindi-English or Tamil-English combinations are commonly used during election broadcasts.
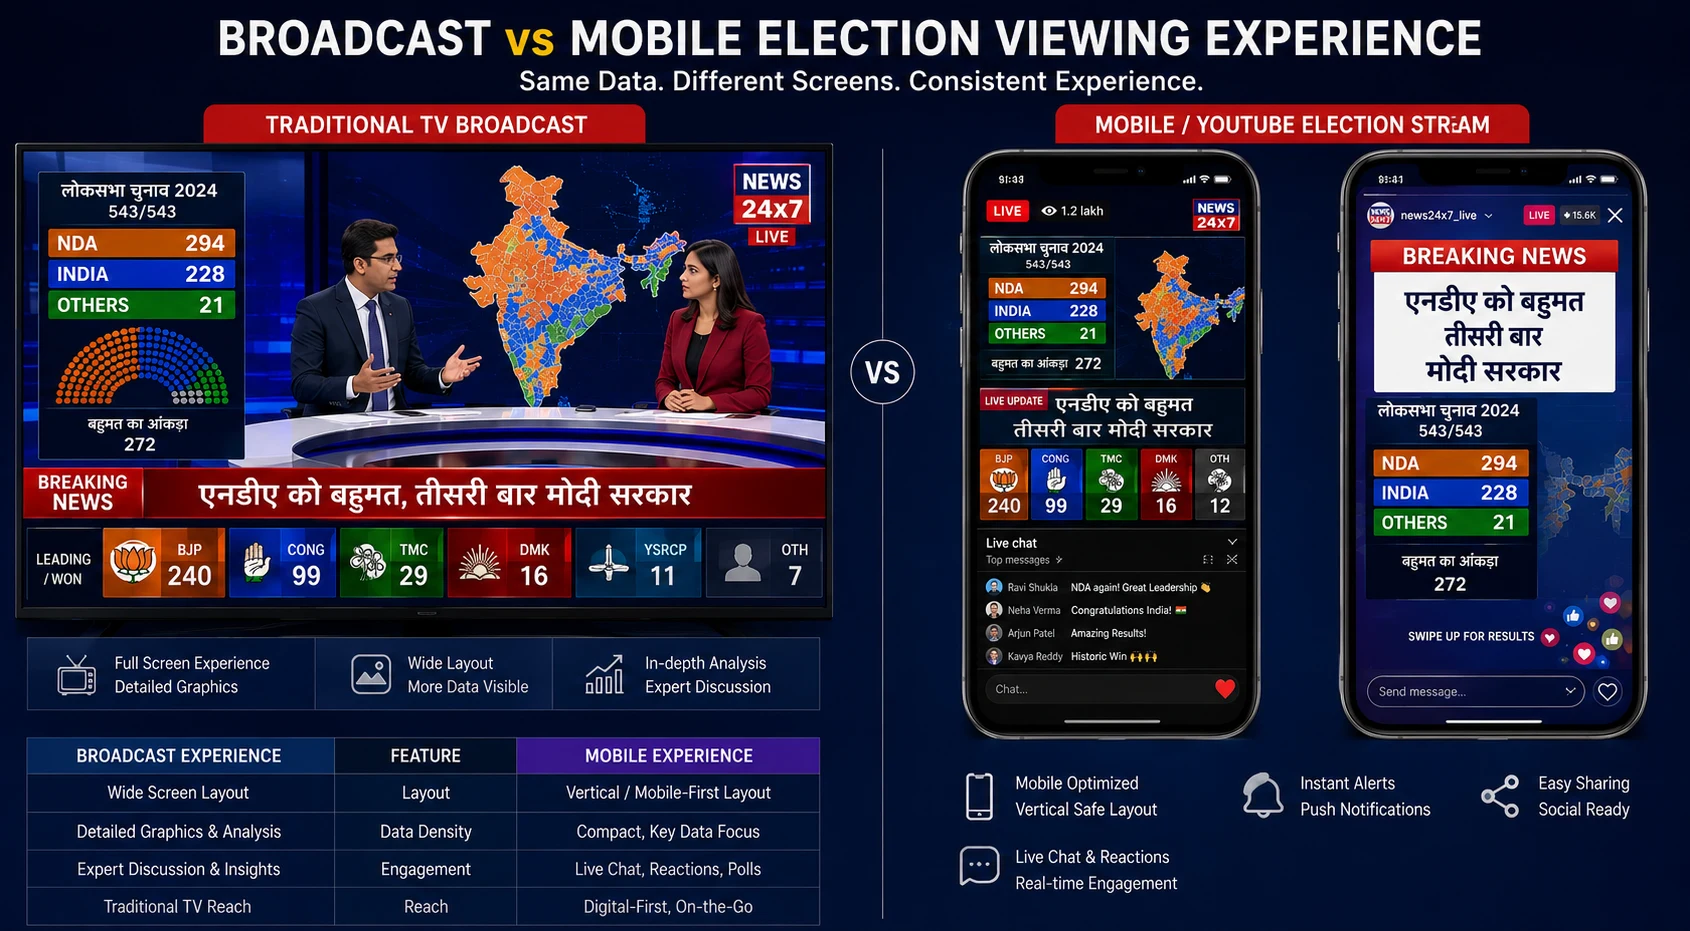
Digital-first news platforms also rely heavily on optimized live stream graphics for YouTube and mobile viewers. Vertical-friendly graphics and mobile-safe layouts are becoming increasingly important in modern election coverage.
Common Mistakes Broadcasters Should Avoid
One common mistake is overcrowding the screen with too much information. Complex graphics may confuse viewers instead of helping them understand the results. Poor font readability in regional languages is another major issue. Small or improperly rendered fonts can reduce viewer engagement.
Delayed updates also hurt channel credibility during fast-moving election coverage. Real-time synchronization is essential for maintaining trust. Broadcasters should also maintain backup systems and redundant workflows to avoid technical failures during critical counting hours.
How to Choose the Right Election Graphics Software
Choosing the right election graphics software depends on multiple factors. Regional broadcasters should evaluate scalability, ease of use, automation capabilities, language support, and workflow compatibility before making a decision.
Smaller teams usually benefit from systems that offer pre-built templates and simplified operations. Broadcasters should also ensure the software integrates smoothly with existing newsroom systems, streaming workflows, and live production environments.
Most importantly, the solution should support regional broadcasting requirements without adding unnecessary complexity.
Conclusion
Regional news channels are now at the center of election coverage in India. Audiences increasingly depend on local broadcasters for constituency-level updates, regional analysis, and real-time political trends.
In this environment, speed alone is not enough. Broadcasters also need accuracy, automation, and visually engaging storytelling.
Modern election graphics software helps regional channels deliver professional-quality election coverage across television, streaming, and mobile platforms while reducing operational pressure on production teams.
As election broadcasting becomes more competitive, investing in advanced regional news channel graphics solutions will play a major role in audience engagement, credibility, and long-term growth.